R/wrangling.R
plot_bars.Rd
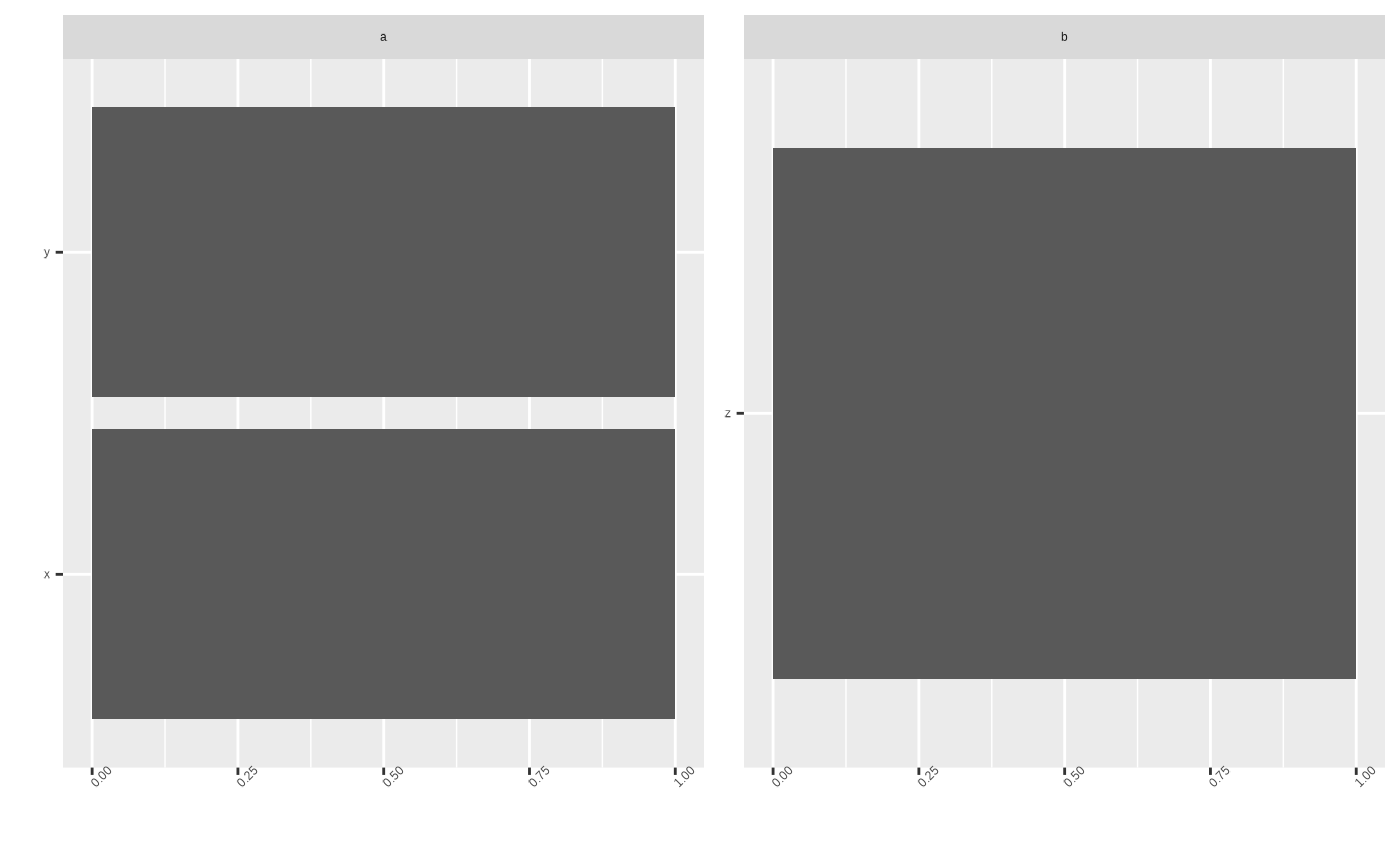
Plot bars for non double columns
plot_bars(df, ..., top_values = 50)
a data.frame
optional parameters to geom_histogram
fist most common values (default 50)
plot_bars(data.frame(a = c("x", "y"), b = c("z", "z")))