Plot histograms for double columns
Examples
plot_histograms(data.frame(a = c(1, 2), b = c(1, 3)))
#> `stat_bin()` using `bins = 30`. Pick better value `binwidth`.
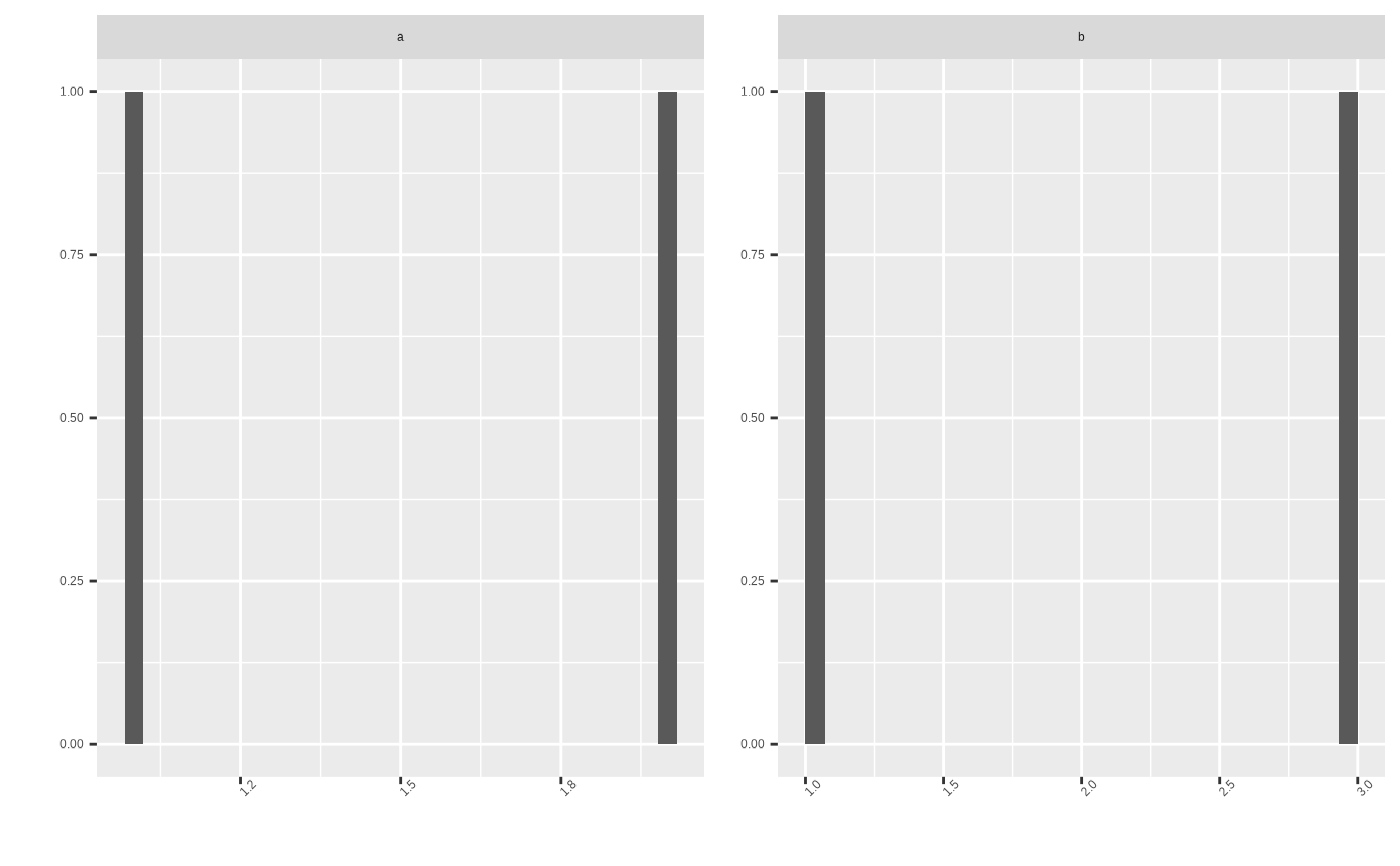
Plot histograms for double columns
plot_histograms(data.frame(a = c(1, 2), b = c(1, 3)))
#> `stat_bin()` using `bins = 30`. Pick better value `binwidth`.