It returns a bar or a histogram of the variable
Examples
data.frame(a = c("x", "y", "y"), b = c("z", "z", "x")) |> plot_variable(a)
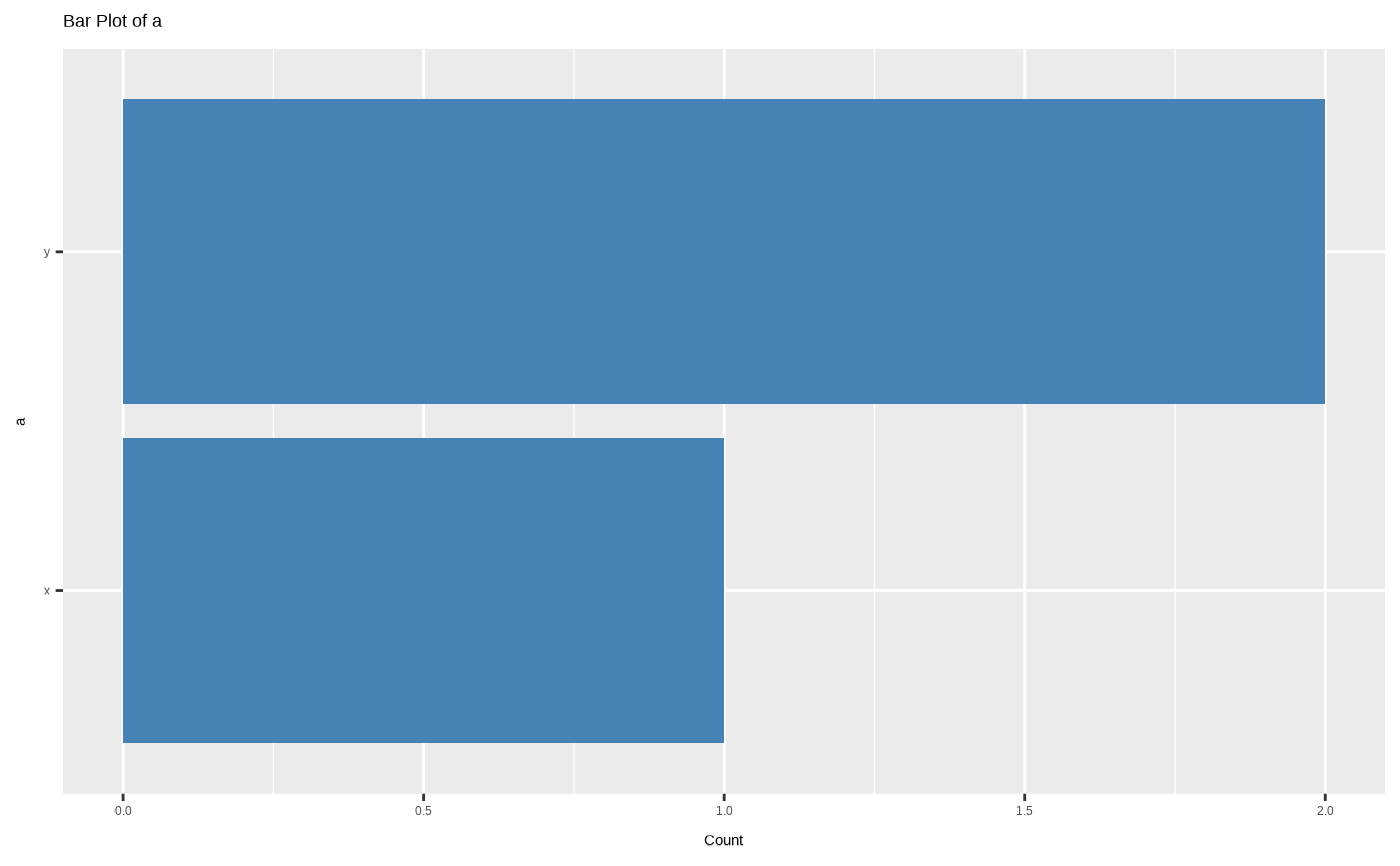
It returns a bar or a histogram of the variable
data.frame(a = c("x", "y", "y"), b = c("z", "z", "x")) |> plot_variable(a)